Quickstart
StripePy is organized into a few subcommands:
stripepy download: download a minified sample dataset suitable to quickly test StripePy.
stripepy call: run the stripe detection algorithm and store the identified stripes in a
.hdf5file.stripepy view: take the
result.hdf5file generated by stripepy call and extract stripes in BEDPE format.stripepy plot: generate various kinds of plots to inspect the stripes identified by stripepy call.
Walkthrough
The following is a synthetic example of a typical run of StripePy. The steps outlined in this section assume that StripePy is running on a UNIX system. Some commands may need a bit of tweaking to run on Windows.
1) Download a sample dataset (optional)
If you need to download the example matrix used here, you can do so by running:
user@dev:/tmp$ stripepy download --name 4DNFI9GMP2J8
Feel free to use your own interaction matrix instead of 4DNFI9GMP2J8.mcool. Please make sure the matrix is in .cool, .mcool, or .hic format.
A more extended description of the subcommand stripepy download is found in Downloading sample datasets.
2) Detect architectural stripes
The stripepy call subcommand is the core of the analysis, designed to identify architectural stripes within contact maps. This process can be quite time-consuming, especially when working with large files.
The path to your contact map file and the desired resolution are required to run the analysis.
For instance, to analyse the 4DNFI9GMP2J8.mcool file at a 10,000 bp resolution, you would use:
user@dev:/tmp$ stripepy call 4DNFI9GMP2J8.mcool 10000
The command will output a single HDF5 file (e.g., 4DNFI9GMP2J8.10000.hdf5).
Additional information is provided in Detect architectural stripes.
3) Fetch stripes in BEDPE format
Stripe coordinates can be fetched from the .hdf5 file using stripepy view, as in
user@dev:/tmp$ stripepy view 4DNFI9GMP2J8.10000.hdf5 > stripes.bedpe
Further details can be found in Fetch architectural stripes.
4) Quickly visualize architectural stripes
It is often a good idea to visually inspect at least some of the stripes to make sure that the used parameters are suitable for the dataset that was given to stripepy call.
We provide a Jupyter notebook visualize_stripes_with_highlass.ipynb to facilitate this visual inspection.
The notebook expects the input file to be in .mcool format.
More info available at Visualize architectural stripes.
Generating plots
StripePy comes with a plot subcommand that can be used to visualize architectural stripes overlaid on top of the Hi-C matrix.
stripepy plot can also generate several graphs showing the general properties of the called stripes, see Generating plots for a complete overview.
For instance, running
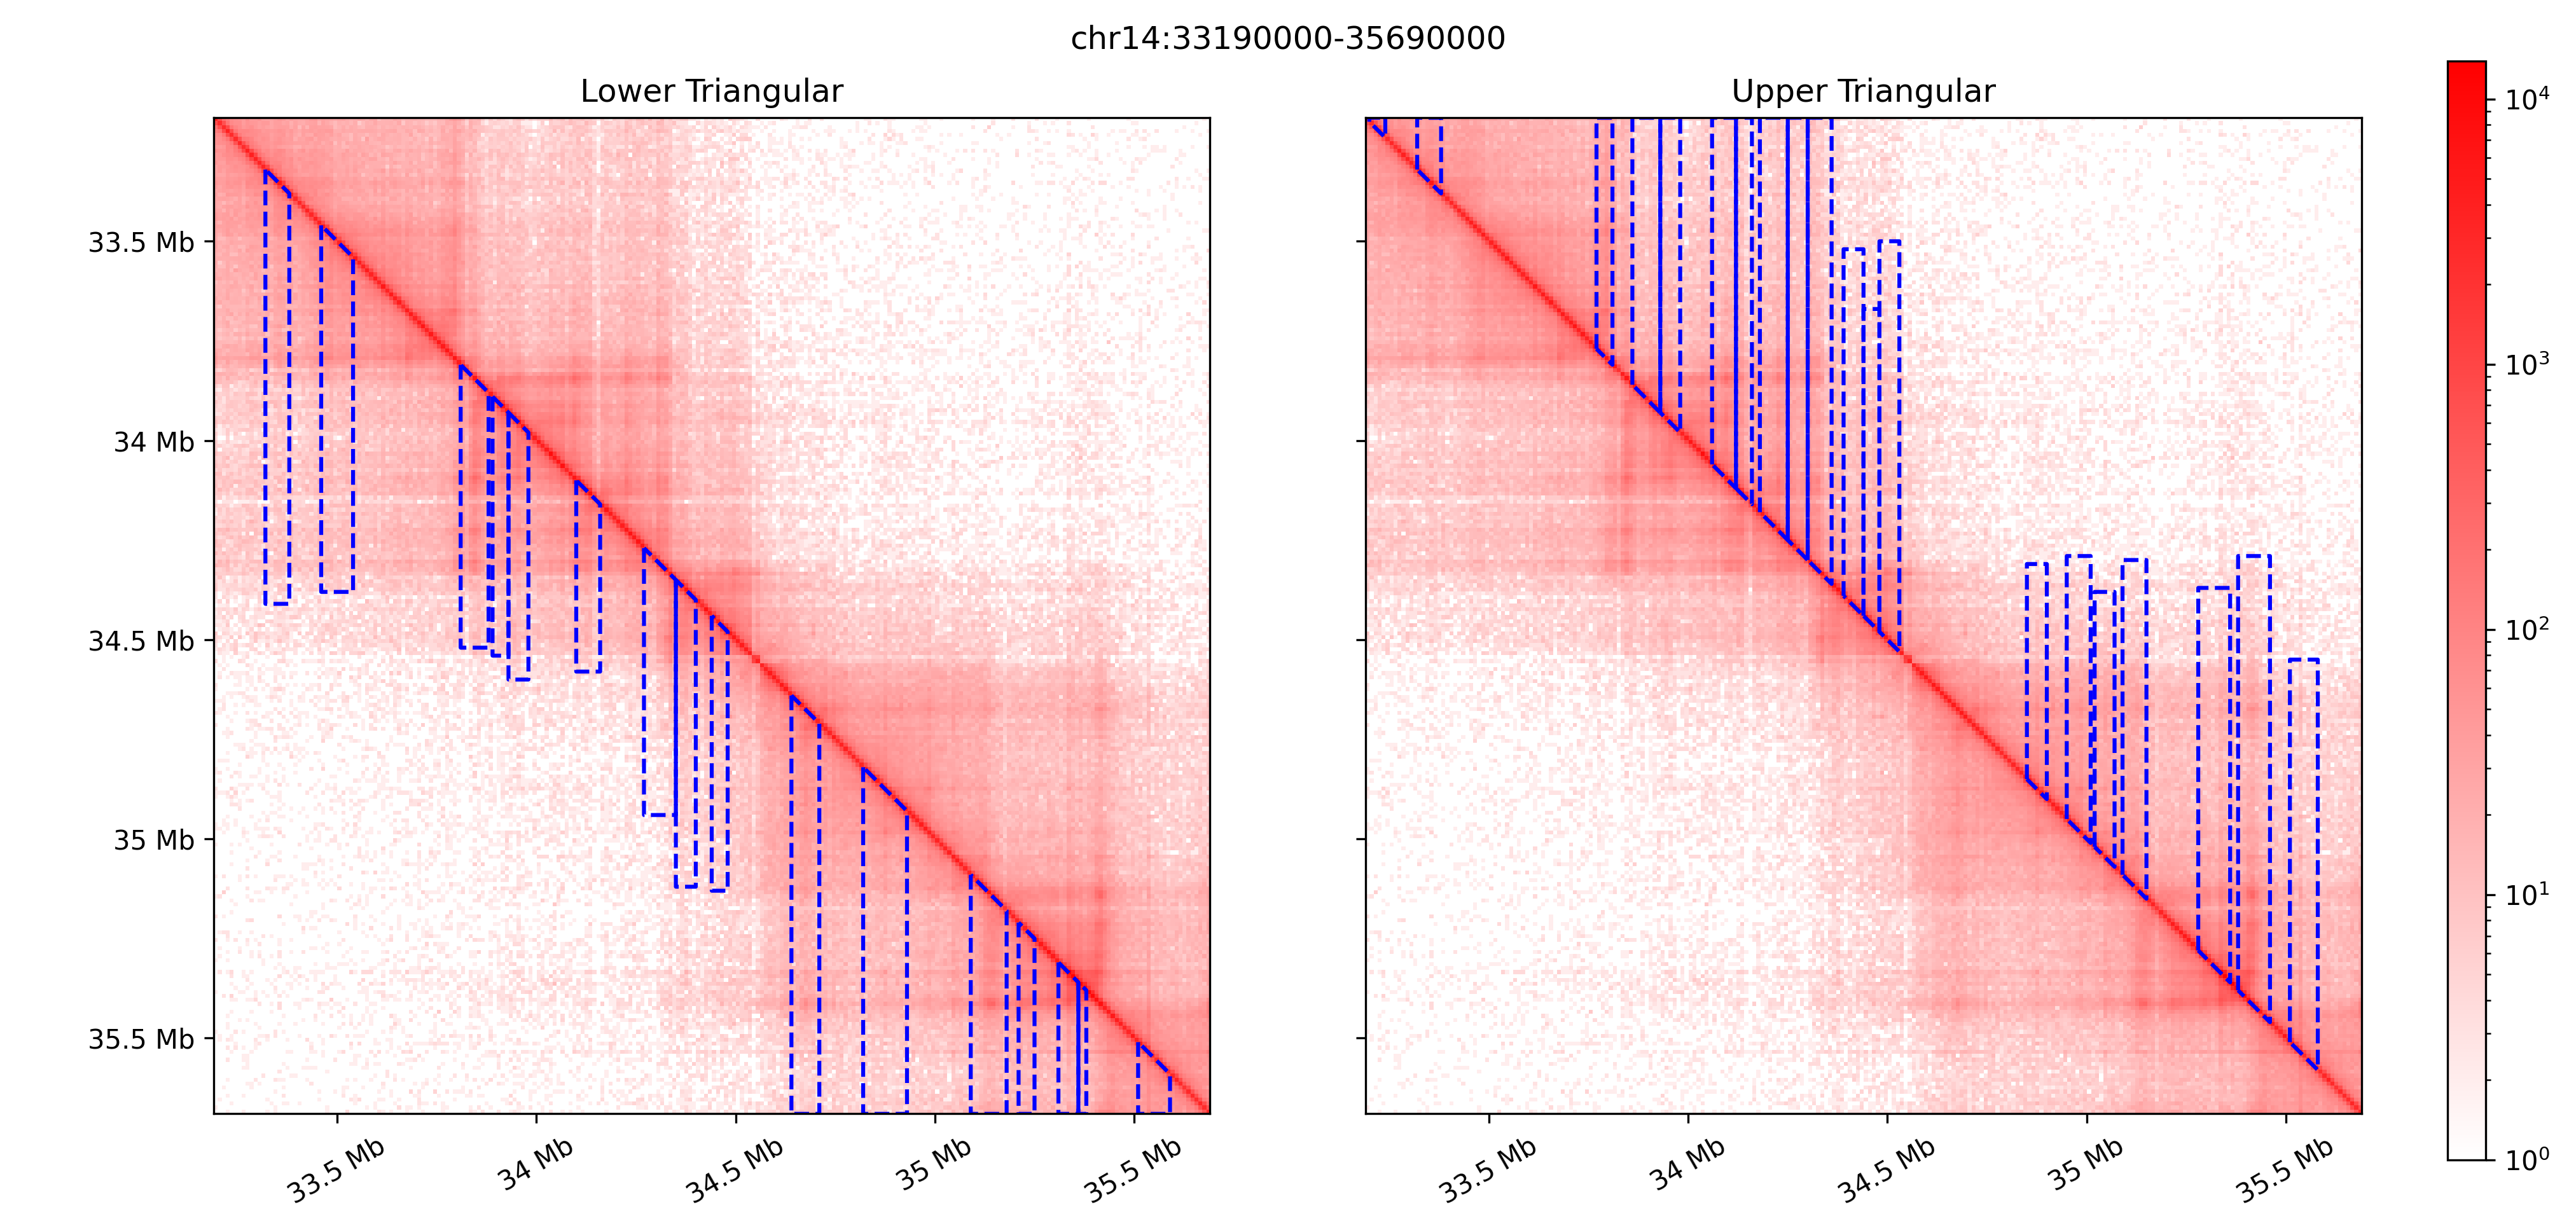
user@dev:/tmp$ stripepy plot cm 4DNFI9GMP2J8.mcool 10000 /tmp/matrix_with_stripes.png --stripepy-hdf5 4DNFI9GMP2J8.10000.hdf5 --highlight-stripes
will generate the following plot